
Why Digital Experience Monitoring Is Moving Into the Developer Workflow
Software teams rarely discover performance problems in a calm e... and the key shift comes next.
Software teams rarely discover performance problems in a calm environment. The signal usually shows up somewhere else first: checkout conversion dips, support tickets spike, or a customer sends a blunt message saying the product suddenly feels slow.
Digital Experience Monitoring (DEM) exists to surface those signals. Tools track page load times, user flows, and real‑world latency so teams can see how the application behaves from the user’s perspective.
The problem is timing. Traditional monitoring surfaces these insights after the code is already live. By the time dashboards light up, customers have already felt the regression.
Many engineering teams are now trying to close that gap by pulling experience monitoring directly into the development workflow.
The Old Boundary: Developers Ship, Operations Watches
In the traditional model, monitoring sat firmly with operations.
Developers shipped features. Operations teams ran the infrastructure and watched dashboards. When something slowed down or broke, an alert triggered incident response.
Digital experience monitoring followed the same structure. Synthetic monitoring simulated key user flows. Real User Monitoring (RUM) captured performance from browsers and mobile devices in production. APM systems traced backend services.
All of this data was useful—but it arrived after deployment. If a performance regression slipped into a release, the system effectively tested itself in front of real customers.
That delay worked when releases happened once every few weeks. It breaks down when teams deploy several times a day.
Continuous Delivery Turned Small Regressions Into Constant Risk
Modern delivery pipelines changed the math.
A single pull request might add a few hundred kilobytes to a frontend bundle, introduce an extra API call, or change a dependency that behaves differently under load. Each change looks minor. In aggregate they can degrade user experience quickly.
The architecture compounds the issue. A typical request path might involve:
• a frontend framework bundle
• internal APIs
• third‑party services
• edge networks or CDNs
• mobile or unstable network conditions
Users experience the combined behavior of all these layers. A small slowdown in any one of them becomes visible at the page level.
If monitoring only begins after deployment, teams learn about regressions after customers do.
DEM Is Becoming Another CI Quality Gate
To shorten that feedback loop, some teams now treat user experience metrics the same way they treat tests or security scans: as automated checks during development.
Instead of relying only on production dashboards, performance tests run inside CI pipelines.
Typical implementations look like this:
• Lighthouse CI checks page performance budgets during builds
• Playwright or Cypress scripts run synthetic user journeys
• k6 or similar tools test API latency against staging
• CI gates fail if performance budgets are exceeded
The idea is simple. If a pull request pushes page load time or API latency beyond a defined threshold, the build fails before the code ships.
Production monitoring still matters. But the first warning now appears during development rather than after deployment.
How DEM Fits With RUM, Synthetic Monitoring, and APM
This shift does not replace existing observability layers. It changes when they are used.
APM still traces backend services to identify bottlenecks. RUM still captures real user behavior in production. Synthetic monitoring still validates uptime and availability across regions.
DEM in the developer workflow acts as an earlier filter.
Synthetic journeys executed in CI approximate user behavior before release. Performance budgets guard against frontend bloat. Staging tests reveal latency spikes before traffic reaches the system.
Think of it as moving the first detection layer upstream.
Instead of asking “Why did users experience this slowdown yesterday?” teams start asking “Why did this pull request increase page load time by 400 milliseconds?”
Why Observability Vendors Are Racing Upstream
This workflow shift is also a market shift.
Traditional observability tools sold primarily to reliability or operations teams. The value proposition centered on debugging production incidents.
But when monitoring enters CI pipelines, the primary user becomes the developer. That changes product expectations.
Developers want:
• CLI tools or APIs
• CI integrations
• pull‑request annotations
• automated pass/fail signals
Dashboards alone are not enough. The signal has to appear where code decisions happen.
This is why several observability vendors now ship developer‑facing tooling—CI performance checks, automated synthetic tests, and GitHub integrations that annotate regressions directly on pull requests.
The battle for developer attention is moving earlier in the software lifecycle.
Follow the Budget: Platform Teams Usually Buy First
Inside most companies, the first buyers are not individual developers. They are platform engineering or developer‑experience teams.
Their job is to keep delivery fast without sacrificing reliability.
Every production incident has a cost: debugging hours, delayed releases, and sometimes direct revenue impact if performance affects checkout, search, or onboarding.
Embedding experience checks in CI reduces that operational cost. Catching a regression during a build might save an incident review later.
That economic argument makes the purchase straightforward. Preventing incidents is cheaper than investigating them.
Once performance checks become part of the pipeline, the tooling becomes difficult to remove. Disabling it means removing a quality gate.
A Practical Starting Point for Engineering Teams
Teams adopting this approach rarely start with a full monitoring overhaul. Most begin with one critical user path.
For example:
Identify a user‑visible metric tied to business outcomes (checkout latency, page load time, login success rate).
Define a performance budget for that metric.
Add a CI step that runs a synthetic test or Lighthouse check.
Fail the build when the threshold is exceeded.
Over time more flows can be added—search queries, onboarding journeys, or mobile experiences.
The goal is not perfect simulation. The goal is early warning.
What Happens Next
User experience is gradually becoming a first‑class development metric.
In many pipelines today, code cannot ship if security scans fail or unit tests break. Performance and user experience are starting to sit beside those checks.
For engineering teams, the next step is straightforward: move at least one user‑critical metric into CI and treat it as a release gate.
For developer‑tool startups, the opportunity is just as clear. The most valuable monitoring tools will not start with production dashboards. They will start inside the workflow where developers review code and run builds.
The product that delivers the first warning about a user‑experience regression will often become the tool teams rely on most.
About the Creator
The Fears of AI And How Much Fun It Can Be
ChatGPT has come a long way, as has AI in general. There are those people who are scared of it, and for understandable reasons. People fear that as technologies advance, they’ll be replaced in the workforce. Then, there are the fears that AI could evolve into something that brings us to the brink of extinction.
By Jason Morton9 days ago in Futurism
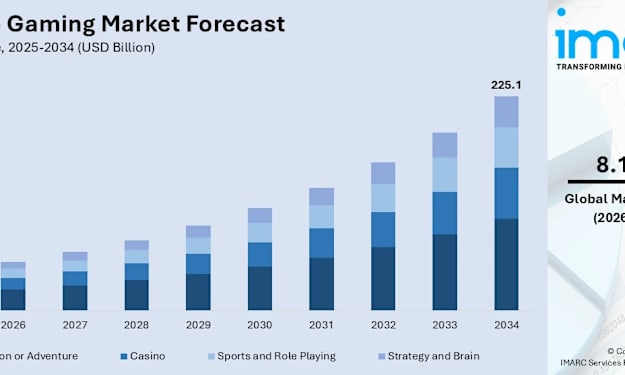
Mobile Gaming Market Insights: 5G Adoption, Real-Time Gaming & Forecast to 2034
The global mobile gaming market is on a strong upward trajectory, fueled by rising smartphone adoption, expanding 5G networks, and a growing appetite for immersive, on-the-go entertainment. According to IMARC Group's latest research, the global mobile gaming market size was valued at USD 108.6 Billion in 2025. Looking ahead, IMARC Group estimates the market to reach USD 225.1 Billion by 2034, exhibiting a CAGR of 8.18% from 2026 to 2034. Asia Pacific currently dominates the market, holding a market share of 58.9% in 2025.
By Suhaira Yusuf5 days ago in Futurism


Comments
There are no comments for this story
Be the first to respond and start the conversation.